I'd like this kind of city to be in a floodplain with a meandering river running through it, perhaps joining with another river. Accordingly I decided to start with the river and build up from there.
Random river construction is not something that is well-documented on the web. Luckily I know Dr. J. Wesley Lauer at Seattle University, who specializes in the interaction between rivers and their floodplains. He's given me a couple of leads to follow.
The simplest model of a meandering river is a sine-generated curve, also known as a meander curve. The river direction oscillates via a sine wave as a function of arc length. Scaling the direction angle results in a river that meanders more or less. Here are some examples (maximum angles of 1.0, 1.5, and 2.0 respectively):
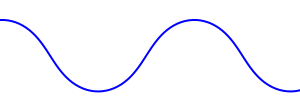
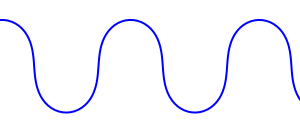
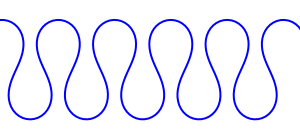
Here's an example with a varying direction angle scale:
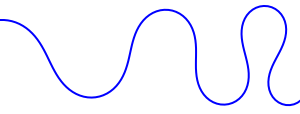
It's really easy to generate these. Here's some Python code I used to generate the SVG diagrams above:
from math import sin, cos

viewSizeX = 300
viewSizeY = 300

x = 0
y = 20
angle = 0

angle_inc = 0.1
dir_scale = 1.0
step_size = 4.0

points = [(x, y)]

while x < viewSizeX:
        dir_angle = dir_scale * sin(angle)
        dir_x = step_size * cos(dir_angle)
        dir_y = step_size * sin(dir_angle)
        angle += angle_inc
        x += dir_x
        y += dir_y
        points.append((x, y))

print '<?xml version="1.0" encoding="UTF-8" ?>'
print '<svg xmlns="http://www.w3.org/2000/svg" xmlns:xlink="http://www.w3.org/1999/xlink" width="%d" height="%d">' % (viewSizeX, viewSizeY)
print '  <g fill="none" stroke="blue" stroke-width="2">'
print '    <polyline points="%s"/>' % (' '.join(map(lambda p: '%g,%g' % (p[0], p[1]), points)))
print '  </g>'
print '</svg>'
The next step is to replace my rather-lame first attempt at river shaping with something based on sine-generated curves. Here's what I'd be replacing:
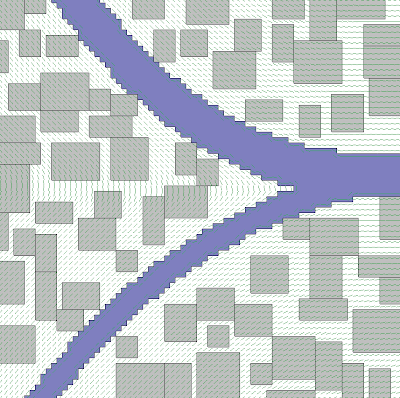
The rivers in this version are based on some quadratic curves. The buildings are just splattered down in such a way as to not overlap; that'll be replaced with an algorithm that generates streets and city blocks and then subdivides the blocks into buildings. There's a bunch of little green lines which represent a gradient estimate, which I may use to guide some of the roads.
3 comments:
Hello, James.
I just find your blog. Amazing!! I really like your work. I'm working in a dynamic branding project for my school and I'd really like to use your river. I'm making test with PyCharm and I'm not able to get an example as you have made. I always get regular meanders. Is there anything I have to take in consideration? Thank you!
It's been a few years. Looking at the code and comments above, I think the thing to do is to make dir_scale not be a constant, and instead be a value that varies. It could be another sinusoid (I'm guessing that's what I did for the bottom diagram), or it could be sampling a Perlin or similar noise function.
Oh! I missed your answer. Thank you so much for taking the time to write. I'll try it right away.
Post a Comment